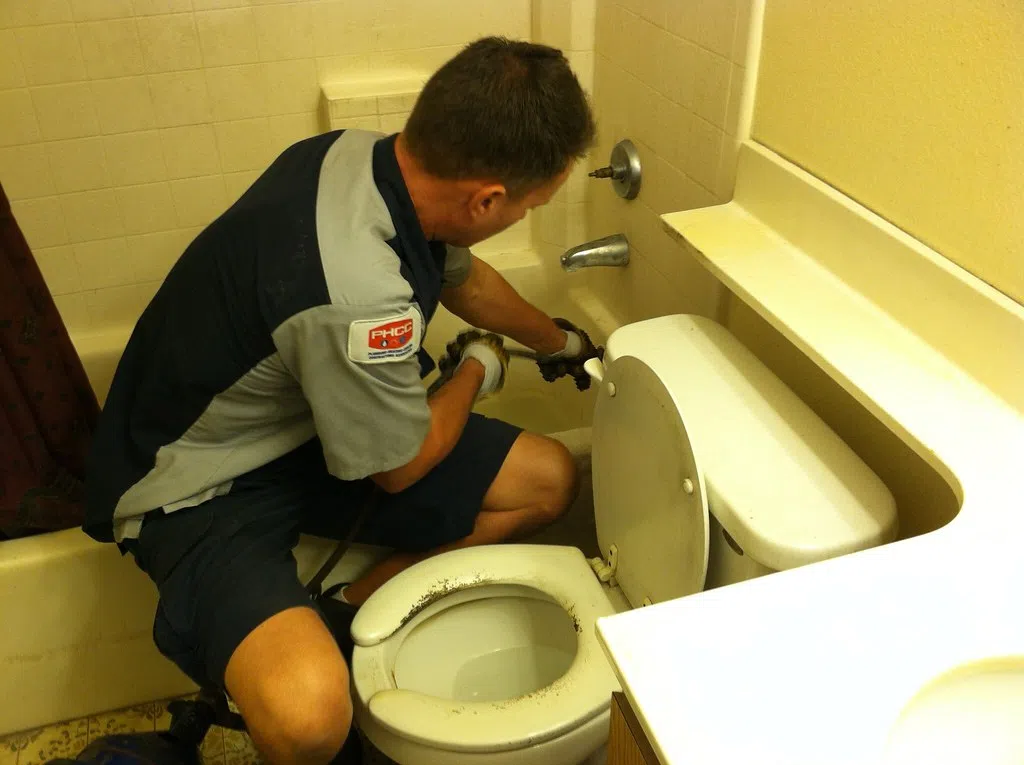
SIOUX FALL, S.D. (KELO.com) — A new study says South Dakota plumbers make considerably more than most South Dakotans but not as much as most of their colleagues nationally.
The survey by Construction Coverage says Plumbers in South Dakota earn a median annual wage of $42,930.
That compares to $36,820 for all workers.
Out of all states, South Dakota is the 4th worst-paying for plumbers.
While 2020 was a year that many industries would soon like to forget, plumbers’ popularity hit all-time highs.
According to Google search trends, searches for local plumbers and other contractors hit their highest levels in five years as more homeowners launched home improvement projects during the pandemic. Whether those homeowners had enough cash to pay for repairs and renovations or tried to do the work themselves and ran into trouble, the result was the same: a call or email to the local plumber.
 |
Search data isn’t the only metric to support the rise in plumber contracting, either. In a September 2020 interview with NPR, Porch.com Chief Economist Max Anderson noted that Americans are spending more on home improvements than they have in the history of the United States—a trend fueled by more time at home, low interest rates, and limited housing inventory.
With business booming, plumbing could be an appealing field of work. As with many service jobs, becoming a plumber doesn’t require a college degree. Rather, individuals can enroll in affordable trade schools or participate in an apprenticeship to sharpen their skill set. The typical plumber makes $56,330 annually, according to data from the Bureau of Labor Statistics (BLS), and the field will grow by 4% by 2029. That growth will open up nearly 21,000 new plumbing jobs in the next eight years. With the plumbing business bursting at the proverbial seams, we looked at where annual wages are on the rise.
On a national scale, plumbers earn 34.3% more than the median annual wage for all workers, according to data from the BLS. And while the national-level data indicates that being a plumber provides above-average pay, state-level data shows a highly regional industry where plumbers in the Midwest make far more than their counterparts in the Southwest, Southeast, and the Mid-Atlantic.
 |
After adjusting for cost-of-living, Illinois, Minnesota, Michigan, Wisconsin, and Nebraska are among the states with the highest median annual wage for plumbers. High wages aren’t confined to the Midwest, though. Alaska has the second highest cost-of-living-adjusted wage for plumbers, while Oregon is fourth. Illinois pays the most with an adjusted salary of $95,544, followed by Alaska ($83,730) and Minnesota ($80,408). Those salaries are in stark contrast to the states with the three lowest adjusted wages: Florida ($43,119), New Mexico ($48,079), and North Carolina ($48,288). The disparity between Midwest states and the Southwest and Southeast is so great, adjusted yearly pay for plumbers in Illinois is more than Florida and New Mexico combined.
To find the best-paying locations for plumbers, researchers at Construction Coverage used wage and employment data from the BLS and cost-of-living data from the U.S. Bureau of Economic Analysis. For each location, the median annual wage for plumbers was adjusted up or down based on the relative cost of living. In expensive areas, wages were adjusted down to reflect lower purchasing power, while wages in less expensive areas were adjusted up to reflect greater purchasing power. Researchers also calculated the relative concentration of plumbers in each location compared to the national level.
The analysis found that plumbers in South Dakota earn a median annual wage of $42,930, compared to $36,820 for all workers. After adjusting for the cost of living in South Dakota, plumbers earn a median $48,895 per year. Out of all states, South Dakota is the 4th worst-paying for plumbers. Here is a summary of the data for South Dakota:
- Median annual wage for plumbers (adjusted): $48,895
- Median annual wage for plumbers (actual): $42,930
- Median annual wage for all workers (actual): $36,820
- Relative concentration of plumbers (compared to average): +27.0%
- Relative cost of living (compared to average): -12.2%
For reference, here are the statistics for the entire United States:
- Median annual wage for plumbers (adjusted): N/A
- Median annual wage for plumbers (actual): $56,330
- Median annual wage for all workers (actual): $41,950
- Relative concentration of plumbers (compared to average): N/A
- Relative cost of living (compared to average): N/A
For more information, a detailed methodology, and complete results, you can find the original report on Construction Coverage’s website: https://constructioncoverage.com/research/best-paying-cities-for-plumbers-2021
(Construction Coverage contributed this report.)


